![]()
Visualization of packet data transmitted by a worm-infected node
Updated: Jun.1, 2007
What is a worm?
A worm is a self-replicating malicious computer program. Unlike narrowly defined computer viruses, it does not need to attach itself to an existing program for infective activities, and is characterized by the fact that it penetrates other computers via the network and self-propagates.
Since 2001, network worms (hereafter referred to as "worms"), including Nimda and CodeRed with advanced functions, have come into existence and threatened network infrastructure and corporate intranets countless times. Although no massive incidents due to new worms have occurred recently, nodes*1 infected by worms which proliferated widely in the past still continue their infective activities. On this page, we attempt to visualize the packet*2 of worms, which remains flowing within the network.
In the HIRT-PUB07004, we attempted to visualize the activities of a worm, focusing on the regularity of a packet (a destination IP address) sent by the worm. In the HIRT-PUB07005, we are targeting visualization, focusing on the completeness (i.e. the scanning scope) and the selection order (the random nature) of a destination IP address.
Usually, worms search for target nodes to propagate themselves and there are said to be some patterns in the search methods. According to data known and released on papers, previous typical worms are classified as shown below:
We observed a node actually infected by a worm within a closed experimental environment and visualized observation data using our proprietary tool.

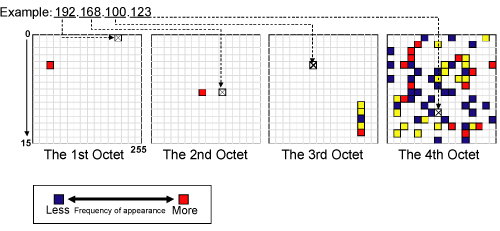
This tool decomposes the destination IP address of a packet sent by the node into 4 octets*3 and visualizes the value of each octet via two measures different from the previous one (HIRT-PUB07004). One measure involves visualizing the degree of bias and range of the octet's value by coloring the relevant ones in the 256 grids. The color shows the frequency of appearance of the value, while a warmer color indicates a more frequent appearance.

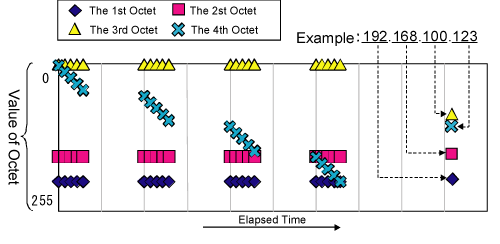
The other measure involves visualizing the selection order and random nature of the octet's value by putting dots based on the value of each octet in a scatter plot, within which the vertical axis indicates the octet value and the horizontal axis the elapsed time.